Intro
Last academic year (2015-2016), Winand Seldeslachts joined Sigasi to work on his masters thesis. For his thesis he investigated a new way to test VHDL code by extending Wavedrom. Wavedrom is a simple, textual language that is used to describe and visualized timing diagrams. Winand investigated how Wavedrom files could be used to generate input for VHDL testbenches.
You can read his report below. All sources are available on GitHub .
VHDL verifier 9000
My name is Winand Seldeslachts, student at the university of Ghent. For my masters thesis i have developed a software tool I call “VHDL verifier 9000” together with Sigasi , as a tribute to the town of Ghent and, mostly, because I can.
Okay, cool name, but what does it do?
Glad you asked.
The VHDL verifier 9000 is a program that runs on both windows and unix based operating systems. It is a tool designed to help VHDL designers in verifying and documenting their design. Let me demonstrate its function using a simple example.
Design example
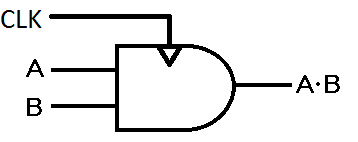
As a young, genious designer, I have an awesome idea: I’m going to design an positive edge triggered AND gate, sell my design and become rich.
So I start implementing my design.
library ieee;
use ieee.std_logic_1164.all;

entity andGate_timed is
	port(A, B, CLK : in  std_logic;
		 Q         : out std_logic := '0');
end andGate_timed;

architecture RTL of andGate_timed is
begin
	process(CLK)
	begin
		if rising_edge(CLK) then
			Q <= A and B;
		end if;
	end process;
end RTL;
Design => ??? => profit.
Before I can start selling this design, I need be able to prove to potential customers that my design works and I need to show them how it works. I need to verify and document my design.
To verify, I implement a self-checking VHDL testbench and simulate it with Modelsim. The output of the simulation for a full functionality test looks like this.

I use WaveDrom to help generate the documentation for this design. My documentation now holds a visual representation of how signals are processed by the design.

If we compare the signal representations in the two pictures above, we can see that both representations look exactly the same, apart from formatting of course. In other words, I have had to use the same information twice: once to document my design, and once to build a self-checking testbench. It makes sense to want to have some kind of tool that could build both documentation and test from one source.
Enter the VHDL Verifier 9000
This was the starting point for the project. The result was the VHDL Verifier 9000. It is a simple tool that can help build both the test and the documentation from one source file. On top of that, it automatically runs the test, analyses the result and offers an easy way find discrepancies in simulation output and expected output.
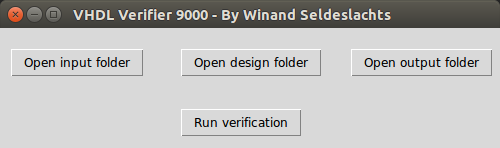
The tool works in an intuïtive way: Clicking a button in the top row will open the corresponding folder. Clicking the bottom button will start the tool. The designer enters all source files in the input folder and his design in the design folder. He then runs the tool. When the tool has finished, the result file will be in the output folder.
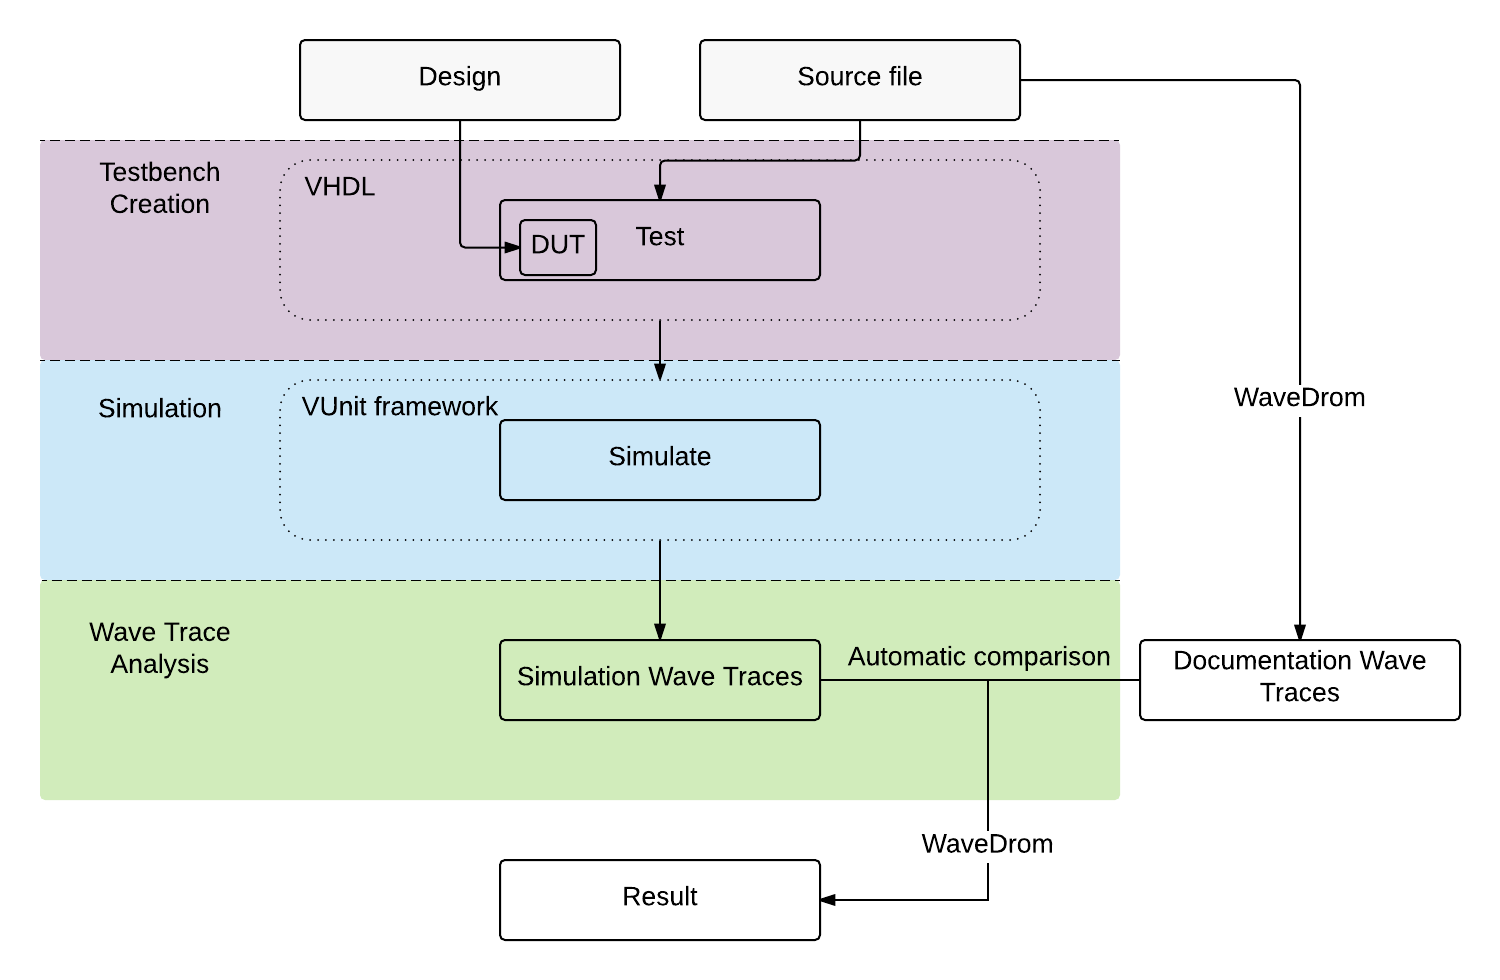
This overview shows how the tool functions internally.
Source files
A source file is the only thing the designer has to create, apart from the design itself. Source files are an extension of standard WaveDrom files. WaveDrom files hold the waveJSON formatted descriptions for signals. The WaveDrom engine converts this description to a visual representation. An example WaveDrom file is shown below.
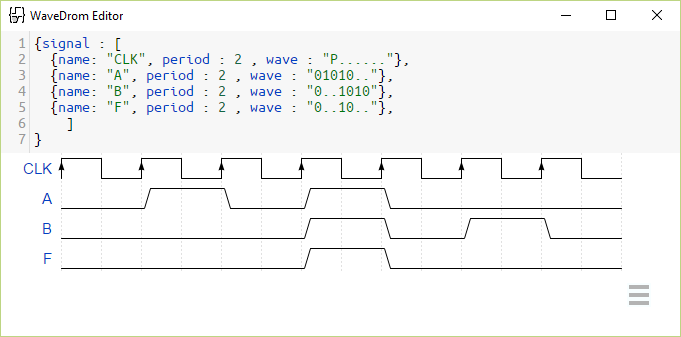
A source file has to hold a lot more information than a standard WaveDrom file. For the clocked AND gate design mentioned above, the source file for a full functionality test is shown below.
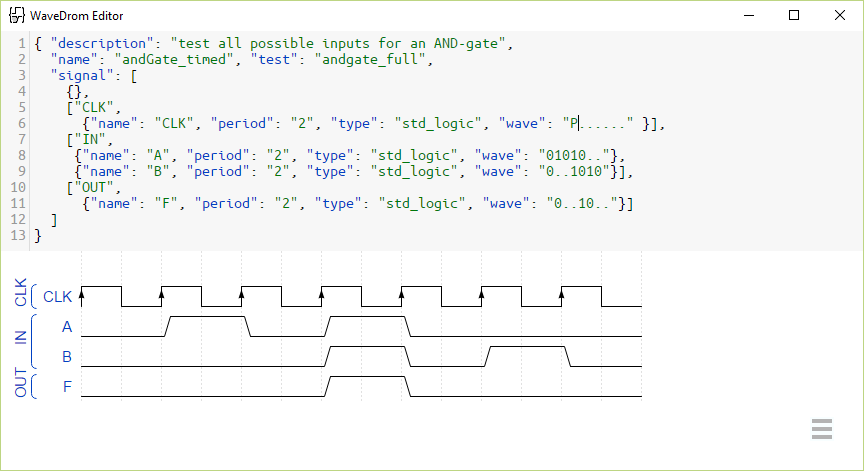
Note that this file can still be processed with WaveDrom to generate the documenation. The resulting documentation image will be exactly the same with both files.
Running the tool
When the tool is run, it combines information from the design file and the source file to generate a testbench. This testbench is then run using the VUnit framework, which logs important information. The output of this process is then used to build a comparison file that will compare the behavior of the design to the expected behavior. This file is called the result file.
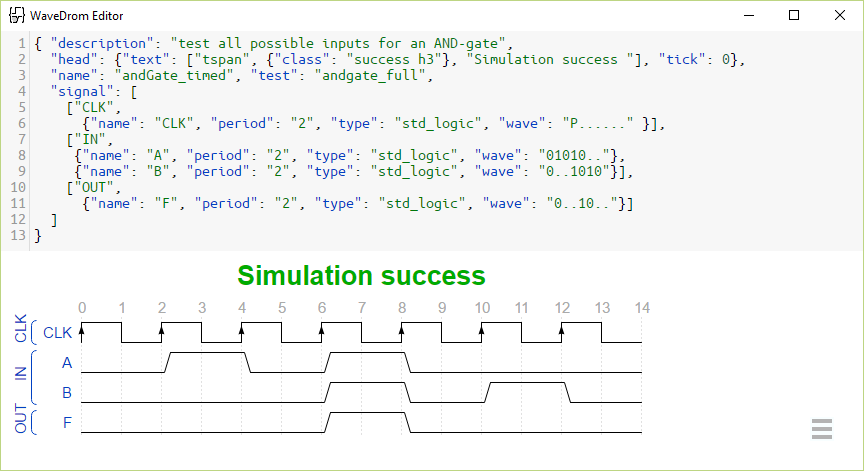
Output files
A result file is very similar to the source file. It is also a waveJSON formatted file that can be processed by WaveDrom. It will show the discrepancies between expected output and simulated output.
In this case the design meets the specifications, so there are no discrepancies between documention and simulation signals.
Is this the solution to all life’s problems?
Perhaps one day. For now it is only a proof of concept that has it limitations. It is useful for relatively simple designs and smaller (unit) tests. For example, for designs the size of an SPI master interface the system will still function, but the result file will become crowded and less readable when there are a lot of errors.
That’s it!
Thank you for reading! If you want to learn more, you can find the source code, the full thesis report and more here .
Finally I would like to thank Lieven, Hendrik and Philippe at Sigasi one last time for the opportunity to do my masters thesis with them and for the support they have given me.
See also
- VHDL IEEE 1076-2008 Grammar (blog post)
- PoC - A Pile of Cores (opinion)
- Block Selection for VHDL Code Editing (screencast)
- Context Sensitive Autocompletion (screencast)
- Smart Indent for VHDL (screencast)