Debug Log
To check whether Sigasi Visual HDL (SVH) started successfully, you should navigate to Sigasi’s output view. You can do this by opening the Command Palette (Ctrl+Shift+P) and selecting Sigasi: Open Log.
The Output View should say Language client connected from ...
The logs in the Sigasi output view might contain errors from the client and server. If errors are present, please copy them and include them in your email to support+vscode@sigasi.com.
SLF4J Errors
The following error messages in the Output View can safely be ignored:
SLF4J: Failed to load class "org.slf4j.impl.StaticLoggerBinder".
SLF4J: Defaulting to no-operation (NOP) logger implementation
SLF4J: See http://www.slf4j.org/codes.html#StaticLoggerBinder for further details.
OutOfMemoryError: Java Heap Space
If Java runs out of memory, you will see java.lang.OutOfMemoryError: Java heap space in the log.
To avoid this, go to the settings (Ctrl+Shift+P > Preferences: Open Settings (UI) > Sigasi) and set the Sigasi > Server: Arguments. Increase the value for Xmx to more than the default 8g.
Troubleshooting
Server Logs
On some occasions, we might ask you to share server logs.
Before obtaining server logs, it’s best to enable debug logging. For more detailed logging, open the settings and change Sigasi > Server > Log: Level to debug.
The location of the server logs depends on your OS.
- On Linux, the logs are below
~/.config/Code/logs - On Windows, the logs are in
%AppData%\Code\logs
Then find [datetime]/window[1]/exthost/output_logging_[datetime]/[0-9]-Sigasi{Tracing}.log.
For each occurrence of [datetime], choose the most recent directory available.
We recommend opening the exthost folder using the command Developer: Open Extension Logs Folder.
Note: These logs contain file names from your project, so only send them to us if you’re allowed to do so.
Issues Caused by VS Code Settings
Ctrl+Click Doesn’t Work
If Ctrl+Click doesn’t Open Declaration, it’s likely caused by an incorrect VS Code setting. In the VS Code Selection menu, there is an entry to switch the multi-cursor modifier to Ctrl+Click.
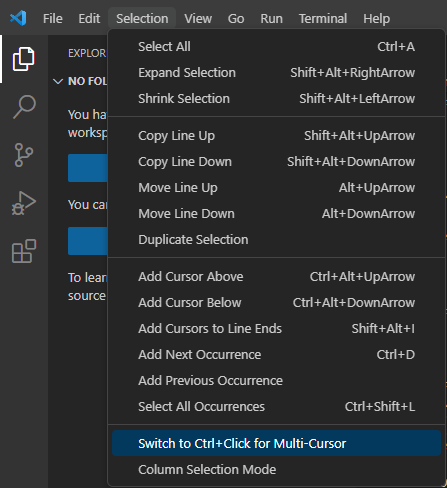
Even accidentally clicking that entry (e.g., when trying to enable Column Selection Mode) will change the setting for the multi-cursor modifier. This results in Alt+Click being used when trying to Open Declaration instead of the usual Ctrl+Click. You can click that same entry again to switch back to using Ctrl+Click.
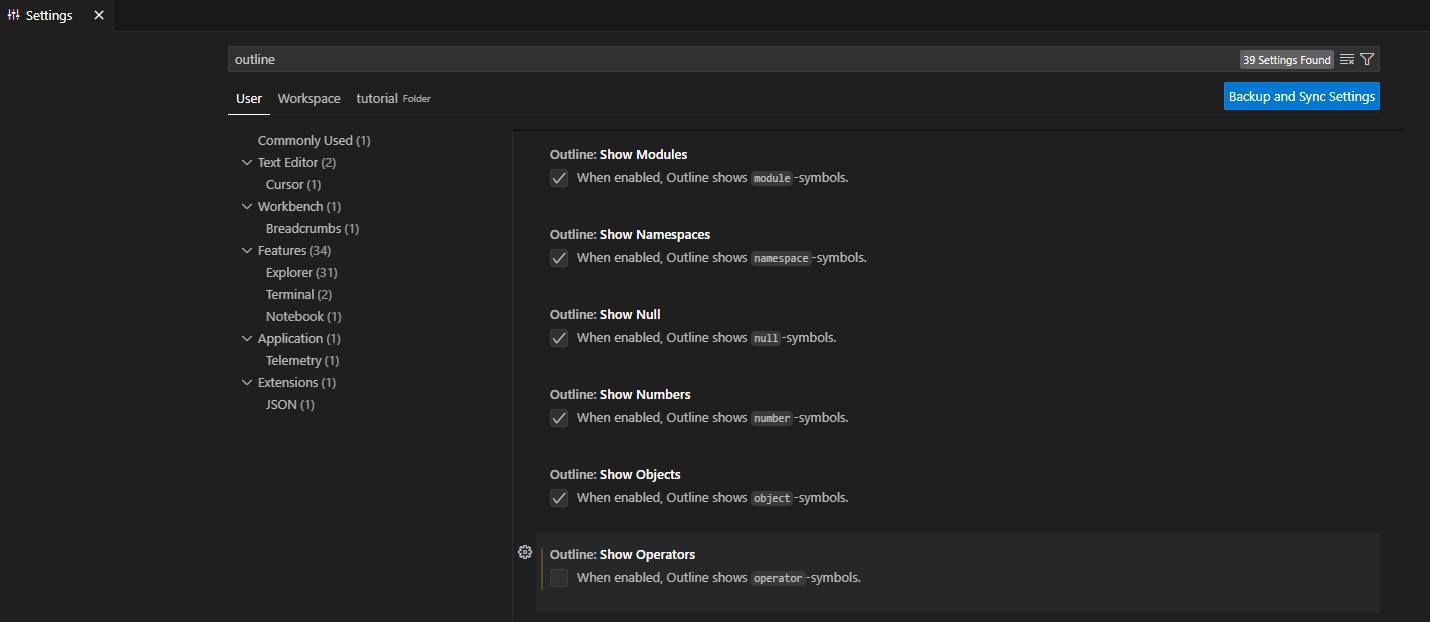
Hide Signal Assignments in Outline
VS Code offers an array of settings to hide symbols from the outline. If you specifically want to hide signal assignments, you have to disable outline.showOperators in the VS Code settings. To do this, navigate to File > Preferences > Settings (or use the shortcut Ctrl+,), and then search for outline.showOperators.