When you open a project in Sigasi Visual HDL (SVH), a number of views are presented in the user interface. Here is a typical screenshot, with the views highlighted.

The views provide alternative ways to access the information in a project. They permit efficient navigation, inspection, and editing.
This chapter lists and explains the most important views of SVH. Some views are not covered here, more specifically some views that are either inherited from Eclipse, or views that are provided by third-party plugins. Please refer to the Eclipse documentation or the specific plugin documentation for further information on those views.
You can open a view in several different ways:
- By typing the view name in the Quick Access field
- Via Window > Show View. If the view is not in the visible list, choose Other… and select the view in the selection dialog. By right-clicking in the editor and selecting Show in > …. Some views also support opening the current selection (e.g. the Block Diagram View). This selects the element in the view that corresponds to the current selection in the editor.
Project Explorer View
This view shows the directory structure of all files in all projects. You can use it to navigate to a particular file in your project and select it. When you double-click on a file, the file opens in the Editor view. If you right-click a file, you see the context menu which offers extra commands.
You can customize the behavior of the Project Explorer View in ways
that can be particularly handy for large projects. For example, if you
click the Link with Editor icon
![]() , the Project Explorer
will be linked to the Editor view. Now, the active file in the editor
view will always be selected in the Project Explorer.
, the Project Explorer
will be linked to the Editor view. Now, the active file in the editor
view will always be selected in the Project Explorer.
You can apply filters to choose which files are shown. Select the icon
View Menu ![]() and then
Customize view. You can then select a filter whose matching files
will be hidden in the view. For example, you can filter out all non-VHDL
or non-Verilog files.
and then
Customize view. You can then select a filter whose matching files
will be hidden in the view. For example, you can filter out all non-VHDL
or non-Verilog files.
The Project Explorer View provides textual and graphical Label Decorations which can be controlled in Window > Preferences > General > Appearance > Label Decorations. Label decorators are a visual guide on the state of projects, folders, and files. Decorators can depend on various plugins. The following descriptions apply to Sigasi-specific decorators.
- SVH adds text decorators to the right to indicate which library a project, file, or folder is mapped in. The library name is denoted in square brackets.
- If a project is in a different folder than the workspace, this is denoted within round brackets.
- Other text decorators to the right of a project are probably from the Git plugin. The repository name and branch are denoted with square brackets.
- Open HDL projects have a bridge-like overlay
 in the top right corner of the project icon.
 - File icons with a ‘V’ in them are VHDL or SystemVerilog source files.
- Folder icons with an overlay in the lower right corner are virtual folders (white square) or linked folders (square with arrow).
- Other overlays in the lower right corner are probably from the Git plugin. They indicate tracked files/folders (yellow cylinder) and non-tracked files/folders (question mark). Changed files are noted with a
>mark next to the icon. - Overlays in the lower left corner are generally indicating status from SVH: errors in files/folders are indicated with a red square and white cross
 while files/folders with warnings are marked with a yellow triangle with black exclamation mark
  .
. - If you exclude a file from build in SVH, the icon will be overlayed with a red forbidden entry icon
 in the upper left corner.
Editor View
The Editor View shows the content of files and allows you to edit files. It is a tabbed view so that multiple files can be opened for editing simultaneously. The currently selected file is the active file.
The SVH Editor offers many features, learn more here.
Outline View
The Outline View displays the contents of the active file, in terms of the HDL objects that it contains.
You can sort the elements in the outline alphabetically, by enabling the
sort button ![]() .
.
You can also filter all concurrent signal assignments from the outline
by enabling the Hide Signal Assignments button
![]() .
Double-click in the Outline View to navigate to the corresponding
location in the editor.
.
Double-click in the Outline View to navigate to the corresponding
location in the editor.
If you enable the Link with Editor icon
![]() and you click an
element in the Outline View, the corresponding code will be selected in
the editor.
and you click an
element in the Outline View, the corresponding code will be selected in
the editor.
Quick Outline View
You can also press Ctrl+O to open the quick outline.
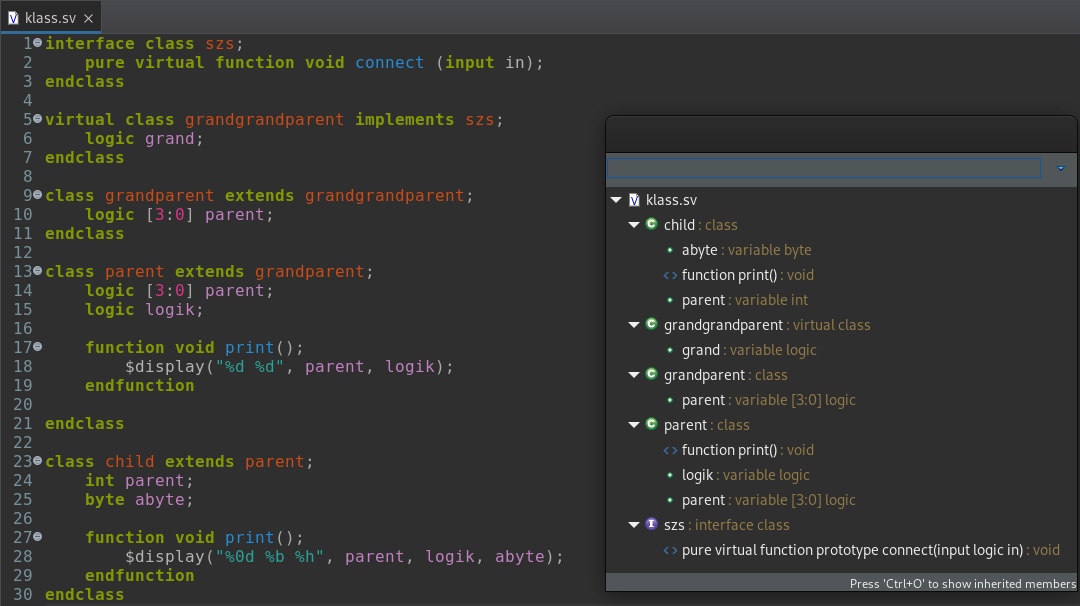
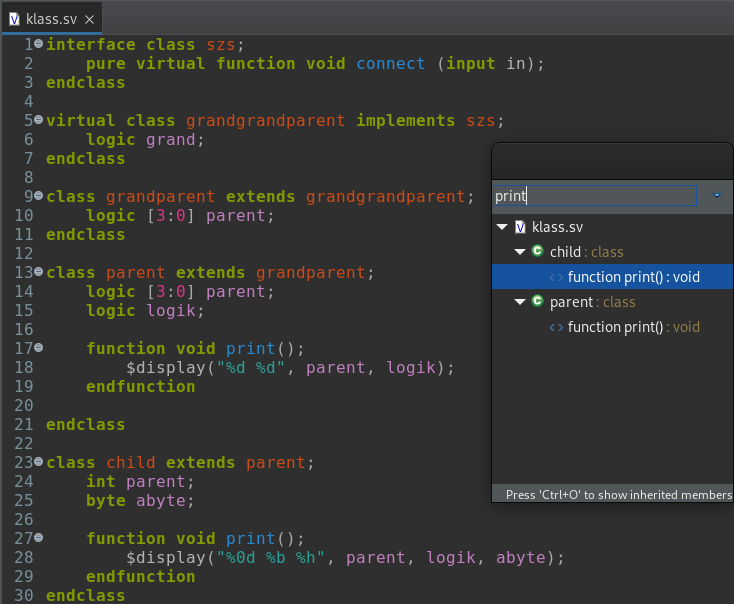
This is just the outline view in a popup, but it also allows you to filter the shown elements. This way, the quick outline can be used as a semantic Ctrl+F, making it very easy to find a declaration in your open editor.
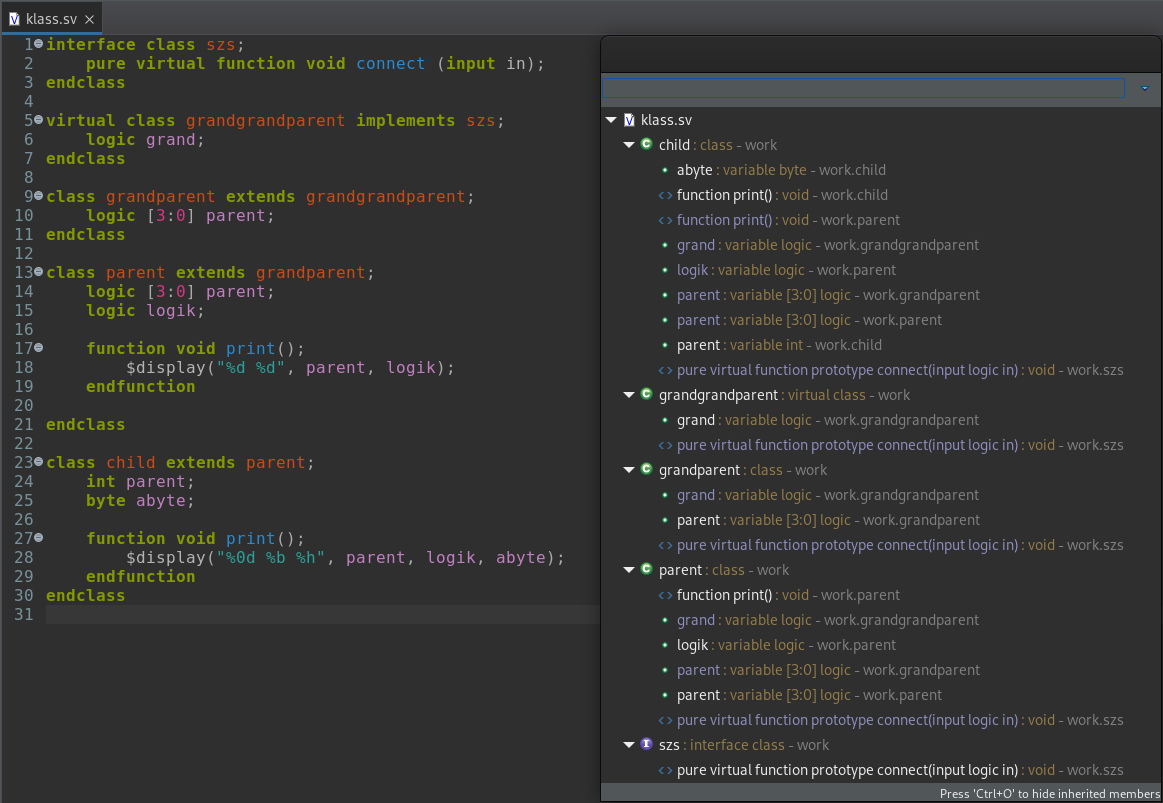
Pressing Ctrl+O again, when the quick outline is open, will also show the inherited members between the members of the current file.
Hierarchy View
The Hierarchy View shows the design hierarchy starting at a selected top level object. To choose a top level, open a file and right-click on an architecture (or entity or configuration or module). Then click Set as Top Level. Alternatively, you can click the Set Top button in the Hierarchy View to open a hierarchy top level selection dialog. You can use the filter field to quickly search for a certain top level.
The Hierarchy View automatically refreshes itself when you save your design files. If you have a really large design this could slow you down. You can turn the automatic refresh on and off by toggling the refresh button ![]() .
.
To highlight the current selection of the HDL editor in the Hierarchy View, enable the Link with Editor button ![]() . If the editor selection is part of the evaluated hierarchy tree, the corresponding hierarchy tree node will be selected.
. If the editor selection is part of the evaluated hierarchy tree, the corresponding hierarchy tree node will be selected.
The Hierarchy View also shows the generic and constants values of VHDL components in the hierarchy. The internal compiler computes the generics and constants, even if they are passed down through the hierarchy, and even if arithmetic operations are used to define new values. If the value cannot be computed for some reason, the Hierarchy View will report the value to be unknown.
When you double-click an object in the hierarchy, the Editor view is updated accordingly, possibly by displaying the contents of a different file.
Use the instantiations filter ![]() to hide everything except instantiations and structural statements.
to hide everything except instantiations and structural statements.
You can launch a simulation with the ![]() button if you first set up a Launch simulator.
button if you first set up a Launch simulator.
The Hierarchy View also offers an action Select required files, which selects all design files that are part of the current hierarchy, in the project explorer. This allows you to easily perform the same action on all files in the hierarchy. E.g. team commands, …
You can also export a CSV file with all dependencies of the selected element via the context menu: right-click and select Export Dependencies to CSV file.
Problems View
The Problems View shows problems (errors and warnings) related to your
code. These problems were reported either by the internal compiler or by
an external compiler tool.
You can navigate to the source of the problem by double-clicking on a
given problem. Problems can be sorted by clicking the column headers.
The content of this view can be customized via the View Menu
![]() . Possible customizations are
scope (workspace, project, selection), type, maximum number of
problems, …
. Possible customizations are
scope (workspace, project, selection), type, maximum number of
problems, …
Libraries View
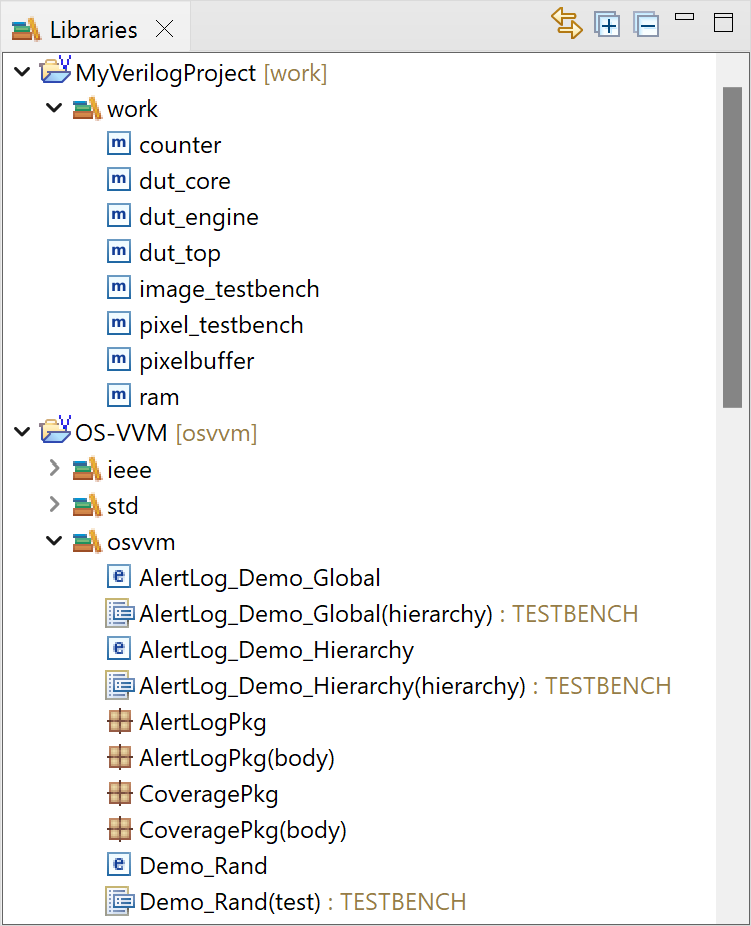
The Libraries View shows the library mapping as well as the description style of the design units in all projects. You can use it to navigate to a particular design unit in your project. When you double-click on a file, the file opens in the Editor view. If you right-click a file, you see the context menu which offers extra commands for setting libraries and for setting the top level.
If you enable the Link with Editor button
![]() , the Library View will
be linked to the Editor View. Now, the active file in the Editor View will
always be selected in the Library View.
, the Library View will
be linked to the Editor View. Now, the active file in the Editor View will
always be selected in the Library View.
Tasks View
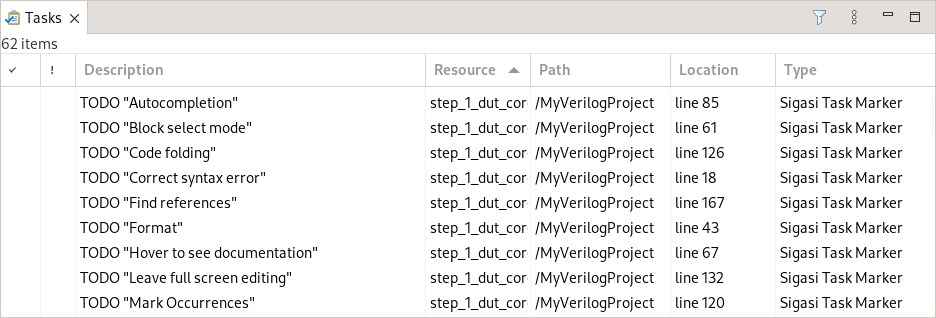
It is common practice to add TODO and FIXME comments in your code. SVH automatically scans your comments for TODO and FIXME tags and clearly highlights these comments with Task Tags. You can get a nice overview of all task markers in your workspace in the Task View (Window > Show View > Tasks).
You can configure extra tags in the Task Tag preference page: Preferences > Sigasi > [Verilog/SystemVerilog | VHDL] > Task Tags
Bookmarks View

You can easily add bookmarks by right-clicking the line number where you want to add a bookmark. You can get an overview of all bookmarks in the Bookmarks View (Window > Show View > Others…).
The Bookmarks View can be used to delete bookmarks or navigate to the editor and other views.
Graphical Views
Block Diagram View
Sigasi Visual HDL Professional Edition or Sigasi Visual HDL Enterprise Edition
The Block Diagram View displays a graphical view of all architectures, modules, their instantiations, and generate constructs in your current editor’s VHDL or SystemVerilog code.
VHDL processes and SystemVerilog always blocks are also shown in the block diagram.
This view automatically updates while you are editing your code and offers a convenient way to visually inspect and navigate your code, even when your code is unfinished or broken.
You can open the Block Diagram View by right-clicking in the editor and selecting Show In > Block Diagram. Alternatively, you can open the view via Window > Show View > Other… > Sigasi > Block Diagram.
You can double-click blocks, ports, or wires to navigate to the corresponding HDL code. If you want to go into a block, you have to select it, right-click, and click Open Entity Declaration, Open Architecture, or Open Module.
To find an object in the Block Diagram, you can navigate from your code to the Block Diagram. In your code, right-click a signal, port, process, generate, or instantiation and select Show In > Block Diagram - just like when opening the Block Diagram View the first time. If the Block Diagram is already open, the corresponding element is highlighted, and the Block Diagram View is centered upon it.
You can export the Block Diagram View to an image with the save
![]() button. Both SVG and PNG are supported. Choose a
button. Both SVG and PNG are supported. Choose a *.svg filename for SVG export or a *.png filename for PNG export.
You can export all block diagrams of an entire project at once: Click Project > Export… > Sigasi > Block Diagrams export and select your project. All SVGs will be created within the sigasi-doc/diagrams/blockdiagrams/ folder in your project.
State Machines View
Sigasi Visual HDL Professional Edition or Sigasi Visual HDL Enterprise Edition
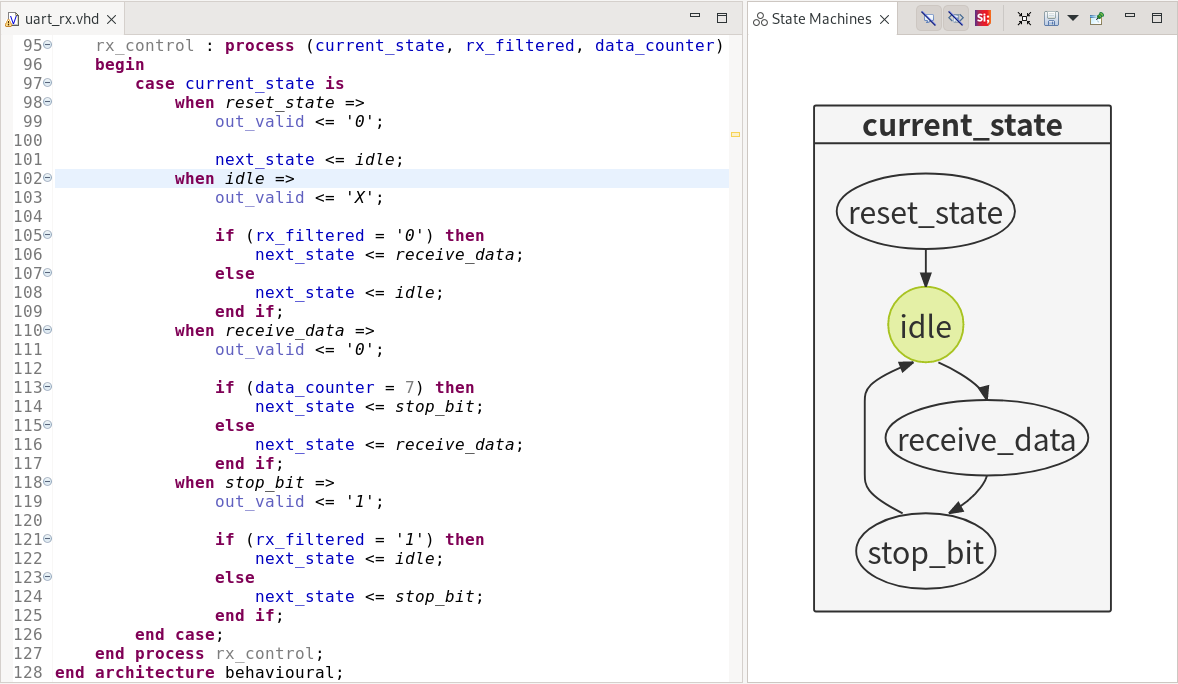
The State Machines View displays a graphical (bubble diagram) view of all state machines in your current VHDL or SystemVerilog editor. This viewer automatically updates while you are editing your code and offers a convenient way to visually inspect and navigate your code, even when your code is unfinished or broken.
You can open the State Machine View by right-clicking in the editor and selecting Show In > State Machines. Alternatively, you can open the view via Window > Show View > Other… > Sigasi > State Machines.
If you have documented your state transitions (i.e., the assignments), the comments will be added as text to the transitions in the view.
You can double-click nodes or transitions to navigate to the corresponding HDL code.
With the ![]() button, you can toggle the display of comments on edge labels.
button, you can toggle the display of comments on edge labels.
With the ![]() button, you can toggle the display of comments on edge labels. These labels show the code comments of the transition statements.
button, you can toggle the display of comments on edge labels. These labels show the code comments of the transition statements.
You also have the option to Zoom In, Zoom Out, or Zoom to Fit.
You can export state machines to an image with the save ![]() button. Both SVG and PNG are supported. Choose a
button. Both SVG and PNG are supported. Choose a *.svg filename for SVG export or a *.png filename for PNG export.
You can export all state machines of an entire project at once: Click Project > Export… > Sigasi > State Machine Diagrams export and select your project. All SVGs will be created within the sigasi-doc/diagrams/statemachines/ folder in your project.
Dependencies View
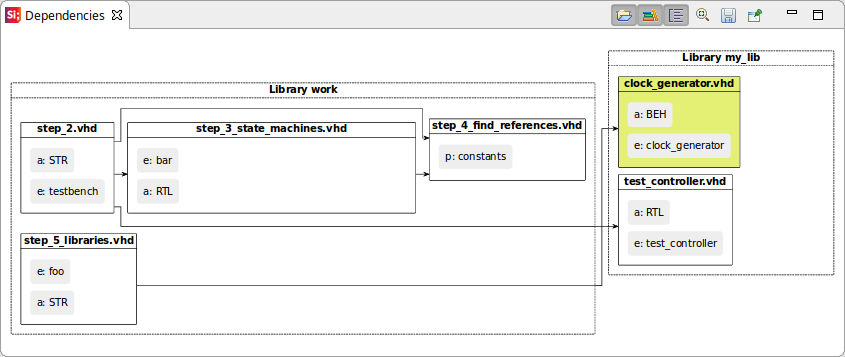
The Dependencies View visualizes the dependencies of your VHDL, SystemVerilog, or mixed language projects. This view shows the relationships between your source files and makes it easy to see top levels and important packages. The Dependencies View also makes it easy to detect orphaned files.
The view is automatically updated each time you save your files.
You can open the State Machine View by right-clicking in the editor and selecting Show In > Dependencies.
The Dependencies View has the following options:
 shows dependencies of the entire project. Uncheck to focus on the dependencies of the active editor only.
 groups design files per library
 shows design units inside design files. The design units are prefixed with an abbreviation of their kind architecture, module, package, …
The Dependencies View can help you navigate, too. Double-click a file name in the diagram to open the corresponding editor.
The Dependencies View can be pinned. This prevents the diagram from changing when you switch editors.
You can export this diagram for documentation by clicking the save icon.
UVM Diagram View
Sigasi Visual HDL Professional Edition or Sigasi Visual HDL Enterprise Edition, [Only for SystemVerilog]
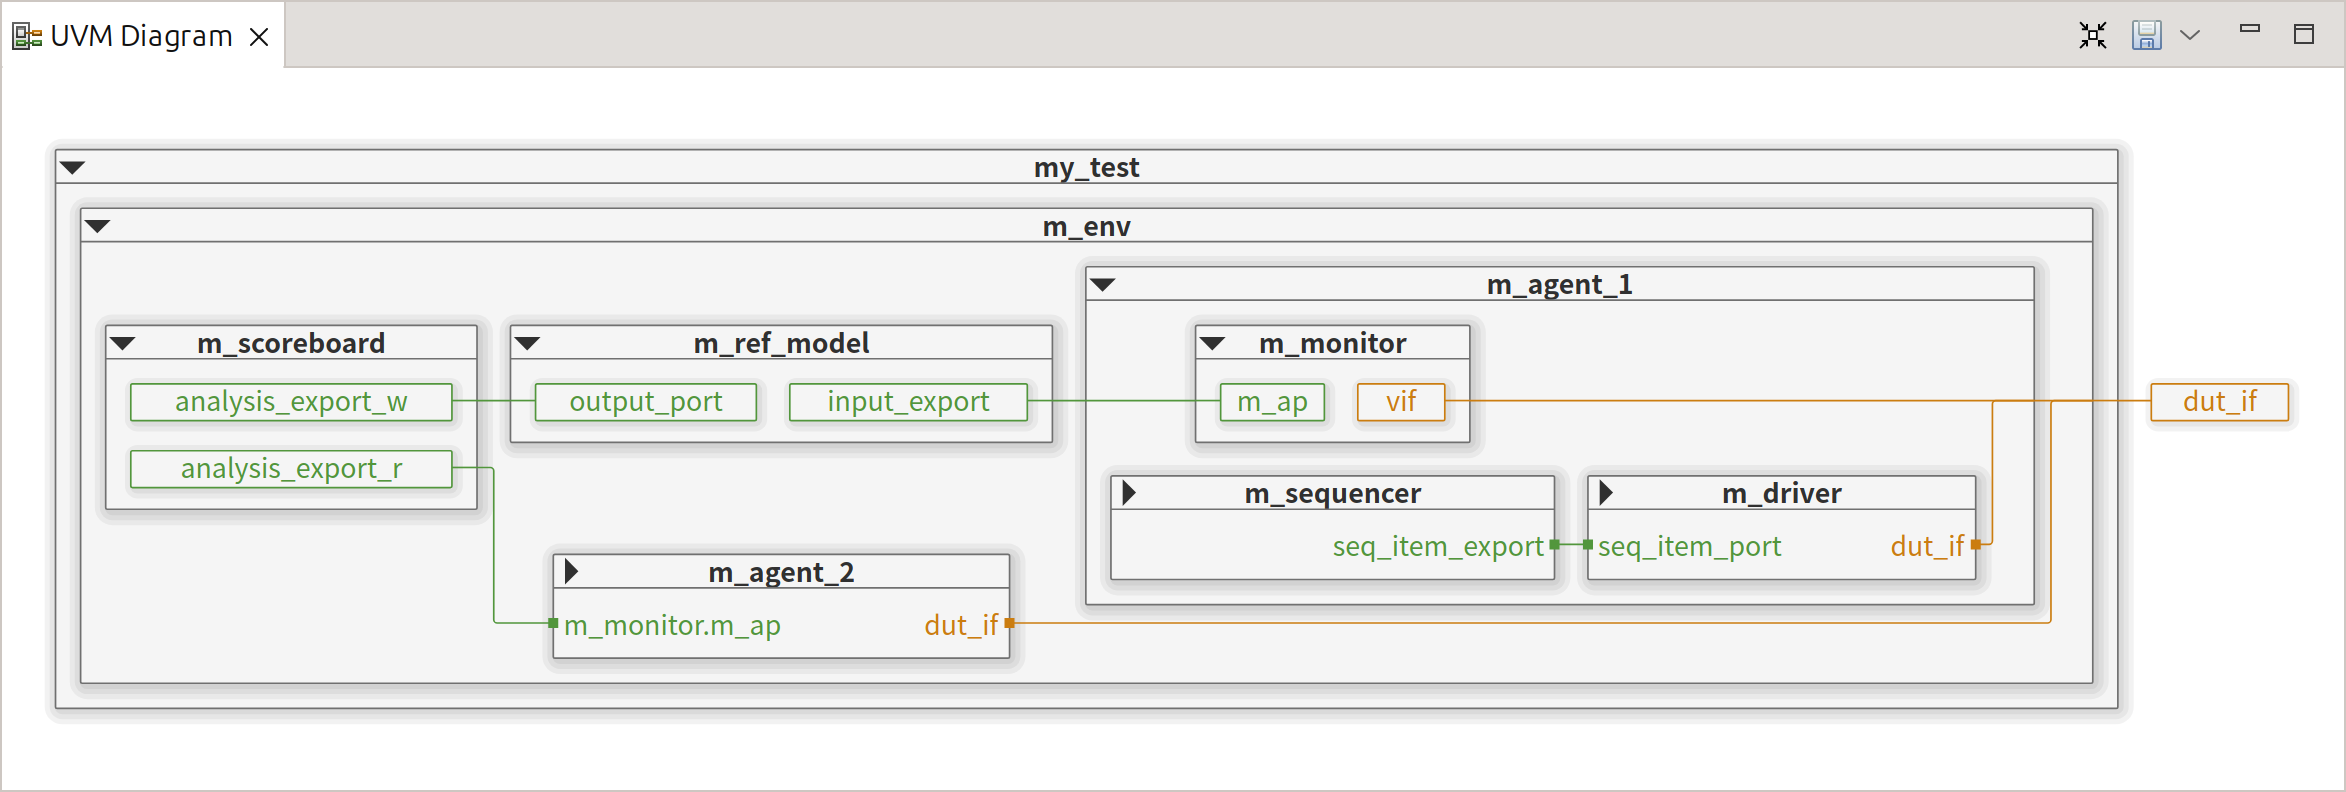
The UVM Diagram View displays a graphical representation of the root UVM component structure through an intuitive graphical display. It visualizes the relationships between components, their hierarchical arrangement in the topology, the connections between ports, and the referenced design interfaces. The dynamic expansion of the diagram allows for efficient tracking of connections throughout the UVM component structure.
Similar to the UVM Topology View, this diagram offers a set of navigation options for each element (both by double-clicking on elements and through the context menu), allowing you to access element’s types, declarations, or instantiations. Double-clicking on a port connection line navigates to the corresponding connect method call in the source code.
You can open the view via Window > Show View > UVM Diagram. Like other diagram views, you can find buttons on the toolbar to Zoom to Fit and export the UVM Diagram as an image (both SVG and PNG are supported).
Documentation View
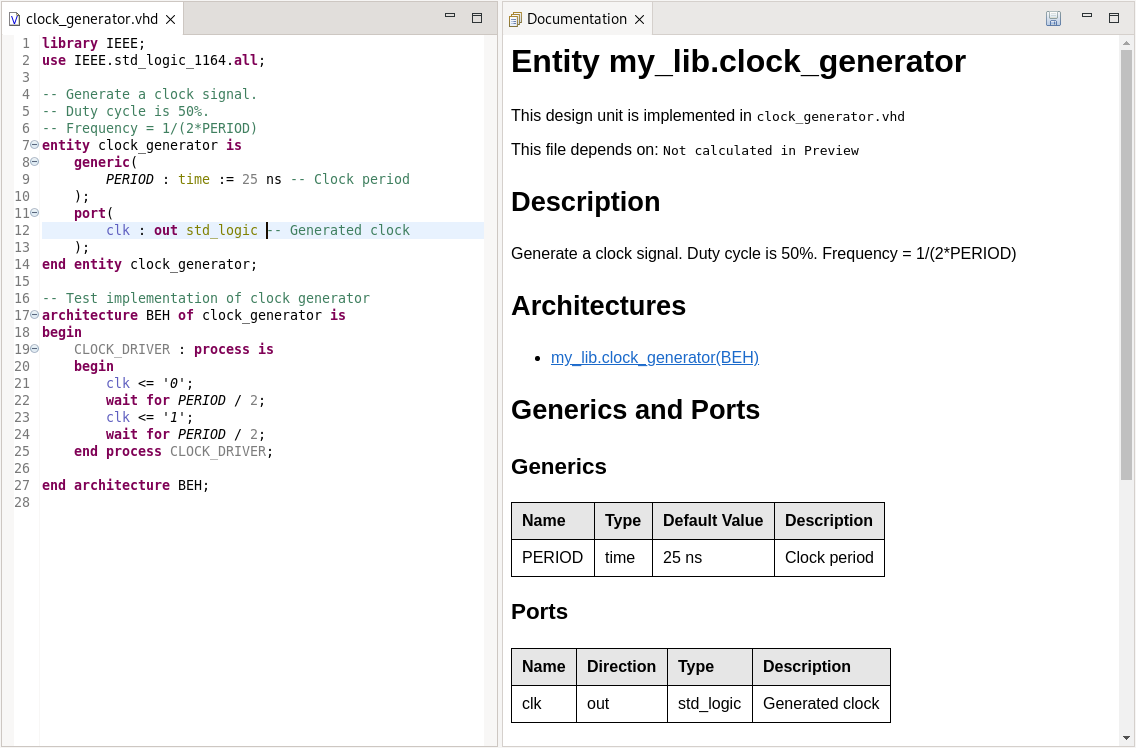
The Documentation View gives you a live preview of the automatic documentation SVH can generate for your project.
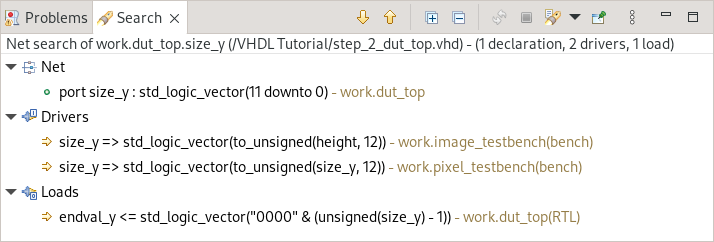
Net Search View
[Only for VHDL]With Net Search, you can find loads and drivers of a net. A net is defined as a signal or port and all other signals and ports that are directly connected to it. The loads are where you read the value of the net, and the drivers are where you write to this net.
To find the entire net of a signal or port, place your cursor on the identifier and right-click. Now select Find Net. Alternatively, you can press Ctrl+Shift+H.
The Net Search View will appear. For big designs, it might take a while before the results appear.
From the Net Search View, you can navigate to the VHDL code by double-clicking the search results.
VUnit View
Sigasi Visual HDL Professional Edition or Sigasi Visual HDL Enterprise Edition
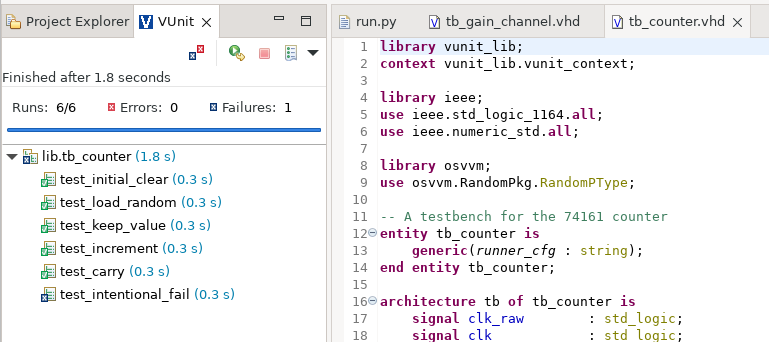
The VUnit View allows you to get a quick overview of your VUnit test runs and to monitor ongoing test runs.
With the icons on top of the view, you can
- Filter the output to show failures only
- Rerun a test
- Stop ongoing VUnit test runs
- View the test run history
More information is available on the VUnit manual page.
Preprocessor View
[Only for Verilog]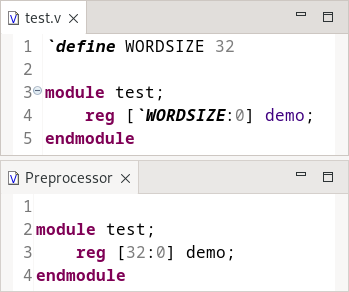
In the Preprocessor View, you can preview the expanded text of Verilog macros. This view automatically synchronizes with the active editor. When you select text in the (System)Verilog editor, the expanded text will be highlighted in the Preprocessor View. This also works the other way: when you select text in the Preprocessor View, the corresponding, original source will be selected in the editor.
Class Hierarchy View
[Only for SystemVerilog]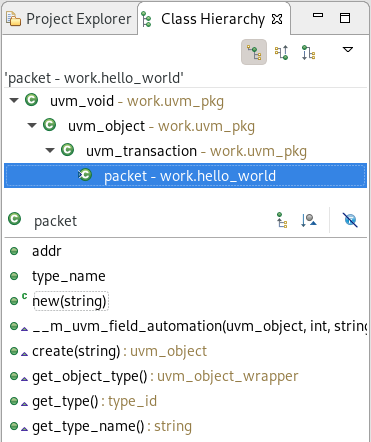
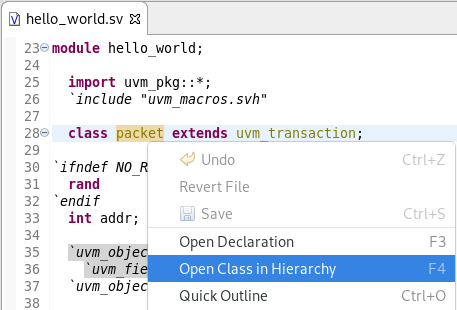
The Class Hierarchy View displays more information about the hierarchy of a class. It consists of a hierarchy tree and a list of the class members. To open the Class Hierarchy of a class, click the class name, right-click and select Open Class in Hierarchy (or press F4).
Class Hierarchy Tree
The class hierarchy tree displays either the superclasses, subclasses, or both.
| Command | Description | |
|---|---|---|
| Class Hierarchy | Displays all superclasses and subclasses. | |
| Superclass Hierarchy | Displays all superclasses and implemented interface classes. | |
| Subclass Hierarchy | Displays all subclasses that extend or implement the selected (interface) class. | |
| Show Qualified Class Names | Shows the qualified name next to each class. |
Member List
The member list shows all members of the class that is currently selected in the class hierarchy tree.
| Command | Description | |
|---|---|---|
| Show Inherited Members | Shows or hides all members inherited from superclasses. | |
| Sort By Defining Class | Sorts members by the class in which they are defined. | |
| Hide Fields | Hides all fields in the members list. |
UVM Topology View
Sigasi Visual HDL Professional Edition or Sigasi Visual HDL Enterprise Edition, [Only for SystemVerilog]
The UVM Topology View shows the verification environment topology starting from a selected root UVM component. Selecting the root UVM component will populate the UVM Topology View with the structure of the selected component and its children, including their ports and virtual interfaces.
The UVM Topology View automatically refreshes itself when you save your design files.
You can navigate to a topology element in an editor by double-clicking it. Right-clicking on an element opens a context menu with more navigation options: you can open the type, declaration, or instantiation of the selected element in an editor. It’s also possible to open the element’s class hierarchy or set the selected component as root.
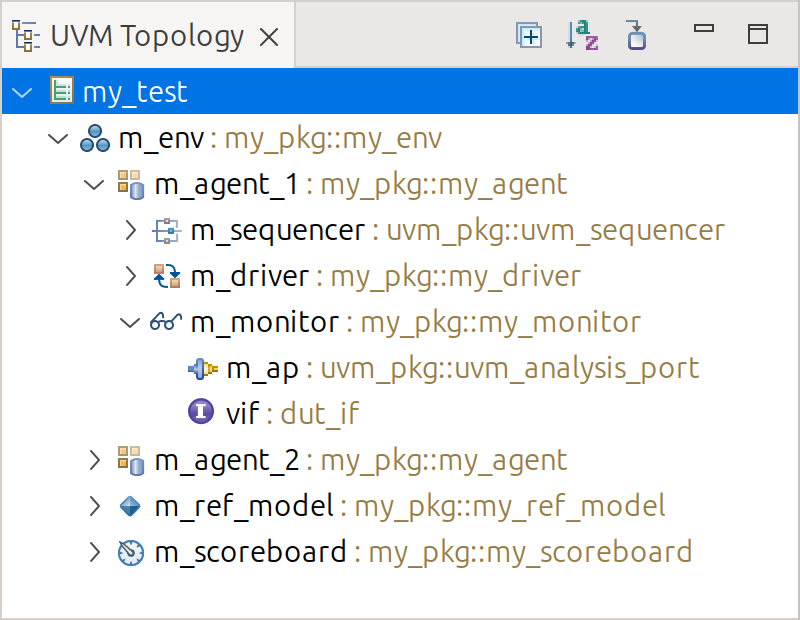
These buttons are available in the UVM Topology View:
| Command | Description | |
|---|---|---|
| Expand All | Expand all component nodes | |
| Sort Alphabetically | Switch between sorting of components, ports, and interfaces by their position in the source code or alphabetically. | |
| Select Root UVM Component | Opens a dialog to select the Root UVM Component. |
Select Root UVM Component
To choose a root UVM component, open a file and right-click on a component’s class name. Then click Set as Root UVM Component. Alternatively, you can click the Select Root UVM Component button in the UVM Topology View to select the root component via a dialog. You can use the filter field to quickly search for a specific component.
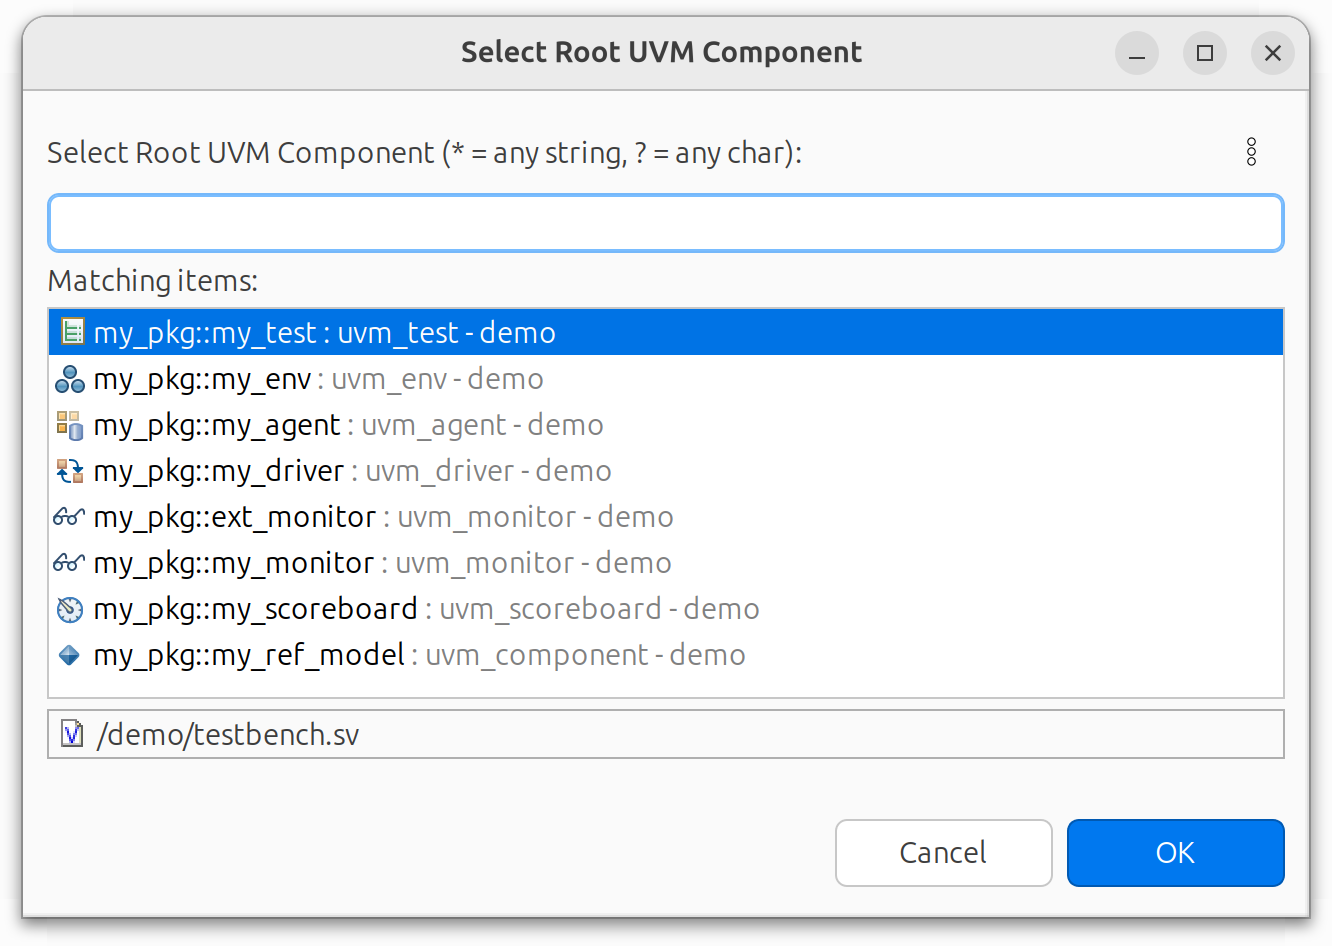
The selected component structure will be shown in the UVM Topology and Diagram views.
Console View
When SVH launches external tools (e.g. external compiler, documentation generation,…) the output is logged to the Console View. This is a generic Eclipse view .
Different tools can open different consoles. You can switch between different consoles by clicking the ![]() -icon.
-icon.
Minimap View
The Minimap View can be opened via Window > Show View > Other… and selecting General > Minimap. This is a generic Eclipse view .
This view is another way to help navigation through large files. It shows an overview of the entire active editor in a dedicated pane. The part that is visible in the editor is highlighted. The highlighted part of the Minimap View can be clicked and dragged to scroll through the Editor View.

